Hi minions:
Allow me to begin by making reference to an element that I believe it is essential to know perfectly:
Request for Comments: 3227 - Guidelines for Evidence Collection and Archiving.
Whenever I have the opportunity, I mention this document because it sets out some basic guidelines for acting in the event of a security incident, in any of its forms. Among many other interesting aspects, (such as the first person who can intervene in a System), are the guiding principles during the collection of evidence, which says that one should proceed to collect evidence from the most volatile to the least volatile and which specifies in point 2.1 on the order of volatility.
(I'm not going to talk to you about kernel, or debugging, or pages of memory...) This would result in an article with a much larger and much more extensive technical depth).
In my opinion, when someone proceeds to intervene in a live System for further analysis, the first technical action to be carried out is the performance of a memory dump. Due to the greater volatility of memory, the acquisition of memory is a fundamental phase in the collection of evidence.
Memory can and should be analyzed because, sometimes, studying non-volatile data will not be enough.
When studying a forensic image of a memory it is played with some advantage in the analysis. In the memory there may be data corresponding to other data stored on the hard disk or you may encounter anonymous data that is not stored on the hard disk. It is therefore necessary to act quickly, altering as little as possible the memory itself that you want to capture.
The more time that elapses, as well as the more activity there is in the System, the fewer options there are to collect useful information from the memory because the memory is constantly changing. Therefore, using tools to capture the memory alters the memory and, therefore, also alters the memory image that is being acquired because the memory is not 'frozen'. So how do you preserve the volatile data contained in RAM? There is no acquisition method that comes close to 100% to maintain memory integrity. Memory will always be modified.
Data can survive in memory for a certain amount of time. For example, you may be able to retrieve an image that has been opened on a System from an external device, where the thumbnail view itself is housed, so it is not possible to see the content of the image elsewhere. If the image still remains in the memory, it can be extracted, even if it is fragmented.
It is possible to carry out a 'carving' on the forensic image of the memory; it is possible to carry out a timeline of it; it is possible to obtain hashes or credentials that are in use of, for example, encrypted content in the System; to export keys of the Registry of Windows, Logs of Events, etc.; it is possible to see processes in execution, historical processes, hidden processes, network connections, ...
The same options that you can carry out on an image of a hard disk, can carry out on the memory. (on this I have pending to publish a 'work' for more than a year. 😕😕)
Very interesting data can be extracted from the memory. Key data can be obtained for the successful resolution of the case. I almost dare to say that you can solve a case only with the proper study of memory, (I'm opening the umbrella 🙄🙄).
There is no doubt that each scenario has to be evaluated because each of them will have its own characteristics. For example, it is not the same case, nor does it require the same study, the analysis of an e-mail header as a case in which child pornography content is found.
But before we start analyzing the memory, it must be captured. For that reason it is vital to choose the right tool to use, to capture as much raw memory as possible.
It has been spoken in many articles, on many occasions, of the existing tools that can be available to carry out such an action, explaining its basic operation. But nothing has been said about the impact that the execution of these tools have on the memory itself.
The test environment
If you're trying to collect as much raw memory as possible and you're trying to maintain as much of that memory as possible, why not do a study of the impact of the tools you use, beforehand? In the study that I present below I have taken into account both the resource consumption of the memory itself and the duration of the acquisition. Both aspects, in my opinion, are extremely important.
The tests have been carried out on my own System: A Windows 10 System, in its compilation '17763.292', which has 15306 MB of memory size; as well as a Windows 10 System, in its compilation '17763.253', (which you can download from Microsoft's official site), virtualized under VirtualBox, with an assigned memory of 4096 MB.

For the monitoring of the processes in execution of the different memory acquisition tools I have chosen to use the 'Process Explorer' tool, in its version 16.22, (which you can download from Microsoft's official site).
The values I have taken into account as a reference are those related to the private workspace, which consists of the memory dedicated to that monitored process and which is not shared with other processes, as well as the workspace that is shared with other processes. This size is measured in Kilobytes.
The reference values I have taken into account for the execution times are those related to the time stamps corresponding to the creation and modification of the forensic image of the memory, because the file is generated at the same time that the dump begins and is modified for the last time when the last data is recorded.
In order not to lose any detail during the acquisition of the dumps I have chosen to record the entire process in video using the 'Record That' function of the 'Game Bar', which incorporates the Windows 10 System itself.
As far as the tested tools are concerned, I have chosen to use some of them with free access and more widespread use:
Belkasoft Live RAM Capturer

During memory acquisition with this tool, two processes have been raised: The 'RamCapture64.exe' process, as the parent process, and a child process 'conhost.exe'. The 'conhost.exe' process is responsible for opening instances for each Windows console. In other words, for each Windows console that is opened, a 'conhost.exe' process will appear.
The 'RamCapture64.exe' process has presented a range of consumption values, in its private space, of 1872-1988, as minimum and maximum values. In its shared memory it has oscillated between 11476-11672.
The 'conhost.exe' process has presented a range of consumption values, in its private space, of 7260-7344, as minimum and maximum values. In its shared memory it has oscillated between 16768-16816.

The time taken for this tool to acquire the complete memory of the System was 3,150000003 minutes, as can be seen in the time stamps relating to the creation and modification of the memory image.
DumpIT

This tool allows its execution in two different ways: directly from the executable itself, or from a cmd console, where the configuration of some parameters is allowed. Depending on how the tool is executed, you will be able to find some values or others.
If you choose to run this tool from the executable itself, you will find two processes: 'DumpIT.exe', as the parent process, and a child process 'conhost.exe'.
The 'DumpIT.exe' process has presented a range of consumption values, in its private space, of 1644-1988, as minimum and maximum values. In its shared memory it has oscillated between 8980-9028.
The 'conhost.exe' process has presented a range of consumption values, in its private space, of 7104-7296, as minimum and maximum values. In its shared memory it has oscillated between 17132-17200.

The time it has taken this tool to acquire the complete memory of the System, with this type of execution, has been 7.716666658 minutes, as seen in the time stamps relating to the creation and modification of the memory image.
However, if you choose to run this tool from the cmd console, where some parameters are allowed to be configured, you can find the parent process 'cmd.exe', your child process 'conhost.exe', and the parent process 'DumpIT.exe', your child process 'conhost.exe'.
The 'cmd.exe' process has presented a range of consumption values, in its private space, of 6108-11484, as minimum and maximum values. In its shared memory it has oscillated between 14460-16776.
The 'conhost.exe' process, dependent on the 'cmd.exe' process, has presented a range of consumption values, in its private space, of 8520-8524, as minimum and maximum values. In its shared memory it has oscillated between 22180-22284.
The 'DumpIT.exe' process has presented a range of consumption values, in its private space, of 1688-1776, as minimum and maximum values. In its shared memory it has oscillated between 8900-8988.
The 'conhost.exe' process has presented a range of consumption values, in its private space, of 7192-7280, as minimum and maximum values. In its shared memory it has oscillated between 16540-17012.

The time it has taken this tool to acquire the complete memory of the System, with this type of execution, has been 4.866666662 minutes, as seen in the time stamps relating to the creation and modification of the memory image.
*** QUICK NOTE ***
This tool will provide, at the end, a very interesting report with information related to the KDBG, which will help them to identify correctly the profile of the memory, as well as information related to the file generated, with a hash SHA256, information about the machine where it has been executed, information about the Operating System and information about the version of the tool itself. Very important information that must be attached to the final report.

********************
FTK Imager Lite

During memory acquisition with this tool, a single process named 'FTK Imager.exe' has been set up.
This process has presented a range of consumption values, in its private space, of 21588-22024, as minimum and maximum values. In its shared memory it has oscillated between 50764-51744.

The time taken for this tool to acquire the complete memory of the System was 3.583333333 minutes, as can be seen in the time stamps relating to the creation and modification of the memory image.
Magnet RAM Capture

During memory acquisition with this tool, a single process named 'MagnetRAMCapture.exe' has been set up.
This process has presented a range of consumption values, in its private space, of 9656-10484, as minimum and maximum values. In its shared memory it has oscillated between 32812-34296.

The time taken for this tool to acquire the complete memory of the System was 4,066666664 minutes, as can be seen in the time stamps related to the creation and modification of the memory image.
Memorize

This tool is executed through the cmd console, so they are presented during the acquisition: a parent process 'cmd.exe' with a child 'conhost.exe' process, and a parent process 'Memorize.exe' with a child process 'conhost.exe'. In addition to these processes a 'netsh.exe' process is presented at the end of the acquisition, which is a command line utility, dependent on the 'Memorize.exe' process.
The 'cmd.exe' process has presented a range of consumption values, in its private space, of 5708-11020, as minimum and maximum values. In its shared memory it has oscillated between 14512-16320.
The process 'conhost.exe', dependent on the process 'cmd.exe', has presented a range of consumption values, in its private space, of 7604-7688, as minimum and maximum values. In its shared memory it has oscillated between 19904-20032.
The 'Memorize.exe' process has presented a range of consumption values, in its private space, of 3616-3644, as minimum and maximum values. In its shared memory it has oscillated between 11860-11960.
The 'conhost.exe' process has presented a range of consumption values, in its private space, of 7276-8180, as minimum and maximum values. In its shared memory it has oscillated between 16804-17924.
The 'netsh.exe' process has presented a memory consumption, in its private space, of 980. In its shared memory it has presented a value of 120.

The time it has taken this tool to acquire the complete memory of the System, with this type of execution, has been 6.583333332 minutes, as can be seen in the time stamps relating to the creation and modification of the memory image.
Winpmem

This tool, which runs through the cmd command line, will present a parent process 'cmd.exe', with two processes dependent on it: 'conhost.exe' and 'winpmem_3.2.exe'.
The 'cmd.exe' process has presented a range of consumption values, in its private space, of 2828-5920, as minimum and maximum values. In its shared memory it has oscillated between 4944-4992.
The process 'conhost.exe', dependent on the process 'cmd.exe', has presented a range of consumption values, in its private space, of 7552-7640, as minimum and maximum values. In its shared memory it has oscillated between 20016-20064.
The process 'winpmem_3.2.exe' has presented a range of consumption values, in its private space, of 1840-3824, as minimum and maximum values. In its shared memory it has oscillated between 6720-8948.

The time it has taken this tool to acquire the complete memory of the System has been 5.116666668 minutes, as can be seen in the time stamps relating to the creation and modification of the memory image.
This tool allows the capture of the memory using the network, which can be carried out using the Netcat utility, but this would result in raising another extraordinary process under the name 'nc.exe' that would have a memory consumption, in its private workspace, of about 624 K.
*** QUICK NOTE ***
The execution of this procedure would be through the lines:
winpmem_3.2.exe -m --format raw --output - | nc.exe IP_Destination Port
nc.exe -l -p Port > C:\Test\Memory_Winpmem_remote.raw
********************
The acquisition
Any memory acquisition tool will always dump the entire memory of the System. All generated files will be the same size, unless they are compressed or divided.

In the case of the acquisition with the Winpmem tool, the resulting file will be larger than the memory of the System because, in addition to the same, it extracts and acquires other types of data. Therefore, the resulting file will be a '.zip' file, which is a container that cannot be analyzed directly and that must be decompressed, being found inside the image of the physical memory under the name of 'PhysicalMemory'.

I have come across some articles, with some comments and with some rumors, in which it is said that some tools give problems with sizes greater than 8 GB. This is not true. The main problem I think exists is that the profile is not identified correctly. The profile of the image must be correctly identified before proceeding with the image analysis. All memory images that are created with the tools shown in this article can be analyzed with the appropriate tools, such as Volatility.

Objective data
I am now going to show you the objective data from the tests I have carried out. And the first data that I am going to present to you is going to be relative to time: The time, established in seconds, that a tool takes to acquire the memory of the System.
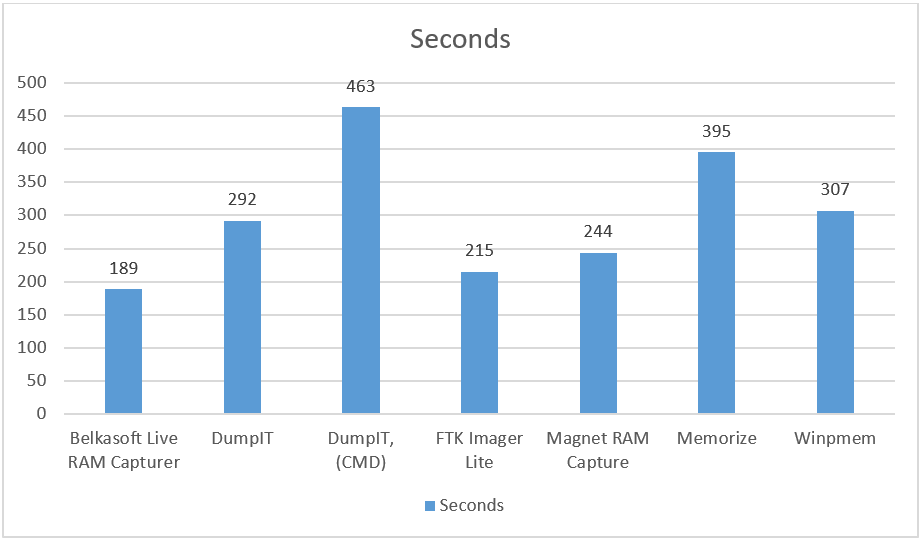
As you can see, in my tests, the fastest tool has been Belkasoft Live RAM Capturer, while the slowest has been DumpIT, by running on the command prompt, where I have specified a format type and an output path. However, the DumpIT tool, if executed directly, without making use of the System Symbol, is not the slowest, leaving that place to Memorize. The difference between the fastest and the slowest is 274 seconds.
I have already told you at the beginning of this article that memory is constantly changing, that it presents highly volatile information. That's why the 274-second difference between the fastest and slowest tool is a very long time. In that time, the possibilities of recovering elements of interest, such as the images that I have given as an example above and that could be found in the memory, decrease.
The next value I want to show you is the memory consumption, in your private workspace, of each of the tools tested.

Because memory is constantly changing, processes will never present a single value. And they won't even present the same range of values in another similar execution.
In my tests, the tool that has used the least resources, private, has been DumpIT, with a minimum value of 1644 Kilobytes, compared to 21588 Kilobytes used by FTK Imager Lite. Even at maximum values, the DumpIT tool consumes less resources, with a maximum value of 1988 Kilobytes, (the same as the Belkasoft RAM Capturer tool), compared to the 22024 Kilobytes maximum value of FTK Imager Lite. You can see that the difference between both minimum values is 19944 Kilobytes. Think about the great amount of information that can be found in that space, and think about the vital information that can be lost by not thinking about that size.
You can think and believe that it is enough with those values, with that comparison, to determine whether to choose one tool or another. But you must also think about the rest of the processes that are raised by the System with each one of the tools and in the space shared with other processes. Therefore, in the following image (I hope it is well schematized), you will find the information corresponding to those data, where I expose the values obtained with the total sum of the consumption of each of the tools.

As you can see, the tool with less total consumption, in my tests, has been DumpIT, with direct execution, if the use of the console cmd, with a value of 24860 Kilobytes. On the contrary, the tool that presents the highest consumption is Memorize, with a total value of 88264 Kilobytes. You are seeing a difference in total consumption of 53404 Kilobytes. Do you know the enormous amount of data that can be found with that size, in that space? Think about what information you can store in that size..
Conclusions
In this article I present just a few small tests that I have carried out with some of the memory acquisition tools that have free access and that I consider to be more widely used. You can try comparing others. Some small utilities, like MDD, or some forensic suite, like OSForensics.
Because memory is constantly changing, no tool will have a single value, neither in resource consumption, nor in time. It will even present the same range of values in two different executions. It is not possible to extract two identical memories. It all depends on the case. Everything depends on the System, on what is being executed at that moment.
I think this is a very good way to compare the way the different tools work, without making subjective assessments, full of interests or opinions, since it is about presenting objective data, with a real environment.
You can continue to use the tool of your choice or you can keep in mind that, since the memory presents very volatile, constantly changing information, you must choose carefully what you are going to execute and how. You can value only some factor of the use of the tools or you can take into account everything that needs to be valued: The memory consumption of each of the tools, both in your private work space and in the shared one, the time that each tool invests in carrying out its function, or the fact that there are tools that facilitate a final report, with information on the profile on which it has been worked.
I only let you know that you have to choose the right weapon to use and calculate the impact that its use has on the memory of the System. A memory that is being acquired in order to carry out a study on it. A study that contains key information for the resolution of a case. Information that will be lost if you do not act quickly and with the right tool.
The analysis of the memory can be a really tedious task but, without a doubt, if it is done in a correct way the results will be highly positive and satisfactory.
That's all.


No hay comentarios:
Publicar un comentario